Atmospheric Chemistry and Composition Group |
||
Prof. Mark A. Zondlo |
||
Department of Civil and Environmental Engineering |
||
Center for Mid-Infrared Technologies for Health and the Environment |
||
Princeton University |
Research
The Zondlo group uses novel optical instrumentation to address key questions in global climate change and air quality. New advances in optical technologies are allowing for unprecedented methods to observe the atmosphere, particularly with respect to cloud and aerosol processes which contribute the largest uncertainty to predicting future climate, and in quantifying emissions of trace gas species. We develop and deploy optical-based instrumentation using mid-infrared quantum cascade lasers and vertical cavity surface emitting lasers and analyze subsequent data to provide more accurate predictions of global climate change, air quality, and emissions of greenhouse gases. We are also increasingly using satellite retrievals to help bridge the gap in scales between intensive field campaign based measurements and the larger spatial and temporal scales that can be accessed using satellite.
Below is a list of current and recent projects:
See also our recently completed projects.
Megacity emissions
Urban areas concentrate a significant fraction of the world’s population into small areas, making them hotspots for emissions of greenhouse gases and pollutants. Their contrast with natural landscapes, including street canyons and paved surfaces, further gives megacities their own localized characteristics and meteorology. The highly heterogeneous nature of cities raises the need for dense, spatially and temporally resolved measurements to support decisions about air quality under the conditions people face every day – whether walking on the street, in a park, or driving on the way to work. We are tackling the problem with a combination of satellite techniques and highly resolved mobile laboratory measurements at the street and neighborhood level. Mobile measurements can help answer questions such as how variable is pollution over scales of meters? Are fine scale features of pollution persistent in time? Linking these data with satellite information will help connect local conditions with larger scale trends and to track the effect of cities on their surroundings. Together this will help better understand the role cities play in public health and climate change, and to view the very breath of cities driven by cycles in our daily transportation and industrial activities. |
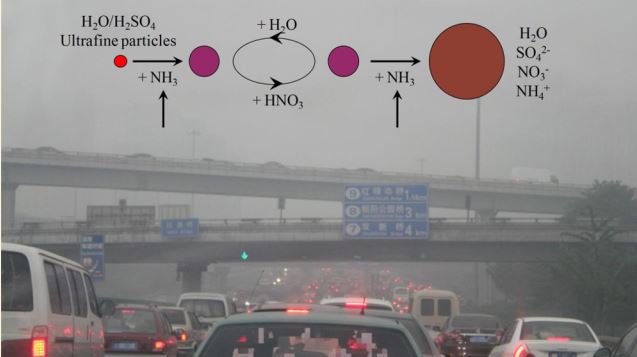 Chemical reactions involving urban pollutants.
|
Satellite ammonia validation and analysis
Satellite observations allow monitoring of gas phase aerosol precursor species, such as ammonia (NH3). As a key precursor to fine particulate matter (PM2.5) and a primary form of reactive nitrogen (Nr) in the environment, NH3 is important in terms of air quality and nitrogen deposition. Satellites have a unique capability for global scale monitoring, while ground-based NH3 measurements have limited spatial representativeness because of extreme spatiotemporal variability. However, validations of satellite NH3 measurements are limited to a small number of pixels of NASA TES or very coarse comparisons of IASI and in-situ measurements of monthly averages. We are expanding validation efforts by comparing satellite NH3 column and vertically-resolved profiles with corresponding in-situ NH3 columns and vertical profiles during the DISCOVER-AQ campaign. Additionally, we are using satellite NH3 measurements to observe short-term spatial and temporal variations, including the variation of NH3 concentrations during fertilizer application periods, and to quantify trends in emissions over time. These data are difficult to acquire with only ground based measurements and will help lead to better predictions of air quality. |
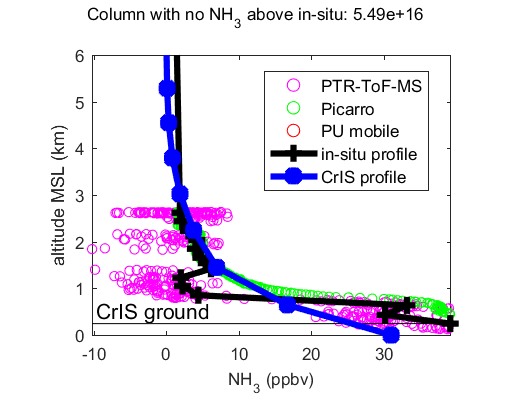 In-situ NH3 profile and CrIS NH3 profile on Jan. 21, 2013.
|
Fugitive methane emissions from petrochemical activities
By using our mobile laboratory in conjunction with micrometeorology measurements and boundary layer models, we are quantifying the distribution of fugitive methane emitted from gas/oil infrastructure in the Marcellus Shale. Mobile laboratories can sample a wide number of plumes emanating from gas/oil pads and compressor stations and chemically fingerprint the source (e.g. with concurrent ethane measurements), yet turning the concentrations into emission rates is challenging. Micrometeorology towers and methods provide more accurate flux estimates but are difficult to sample a large number of sites. By combining these two techniques, and then using large eddy simulation and Gaussian dispersion models, the goal of this project is to quantify the shape of the distribution of emissions in the Marcellus Shale. Highly-skewed, or fat-tailed, distributions suggest that only the largest leakers should be the focus of mitigation efforts, whereas a more normal distribution suggests that basin average measurements are representative for bottom-up inventories. This work is funded by NOAA Atmospheric Chemistry, Carbon Cycle, and Climate. |
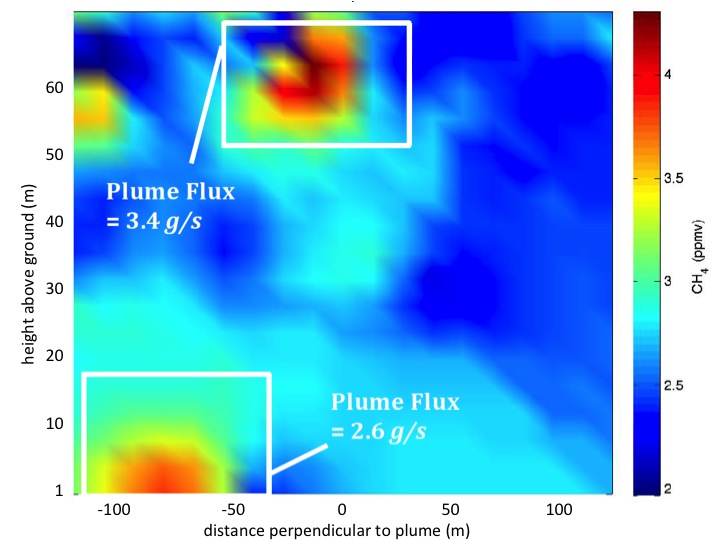 Cross section of a fugitive CH4 plume.
|
Leak detection using unmanned aerial systems
Unmanned aerial systems (UAS), or “drones” as they are often called, have emerged as useful measurement platforms due to their low cost and ability to operate near the Earth’s surface. We are exploring ways to leverage fast, laser-based sensors on UAS for improving leak detection in the natural gas industry. These leaks – containing a mixture of methane and other hydrocarbons - contribute to climate change and can also be a contributor to local air pollution. We have developed, test flown and field deployed our in-situ sensors on a number of small UAS. A remote helicopter conducted spirals around a compressor station in Texas, an elevated emission source which is difficult to fully capture using ground-based surveys. More recently, we developed and flew a sensitive, mid-infrared based, sensor in New Jersey and the ScaleX field campaign in Germany. There it helped study the vertical structure of methane during night-time, where gases accumulate into strata when mixing driven by the sun dies down. We are also working with Physical Sciences to develop algorithms for quantifying and localizing leaks at the well pad scale using their new remote detection UAS system. Continuous monitoring applications demand robust validation for accuracy and minimizing false positives, but will enable companies to effectively track and fix leaks. We are also exploring long-path remote sensing paired with a retroreflector-equipped UAS for pipeline applications, another significant leak source within the oil and gas industry. This work funded by the Department of Energy. |
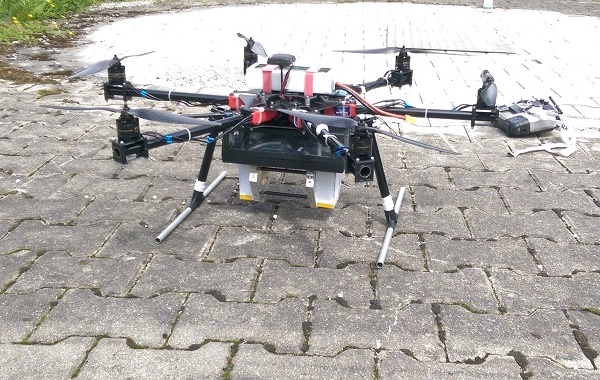 Hexacopter-based methane sensor.
|
Agricultural nitrous oxide emissions
Nitrous oxide (N2O) is often considered as the third most important anthropogenic greenhouse gas. It is also expected to be the dominant ozone-depleting substance throughout the 21st century if its emissions are not controlled. Agricultural activities are the largest sources of N2O emission. Estimations of N2O emissions from these activities remain uncertain due to the episodic and micro-scale nature of N2O production during denitrification processes that occur within very small and discrete “hotspots” in the field. To better assess field-scale N2O emissions with higher temporal resolution and coverage, we have developed 4.5 um QCL-based open-path N2O sensors that provide high-frequency measurements with high precision. These features enable us to measure field-scale integrated N2O fluxes every 30 minutes using the eddy covariance method. Deploying these sensors on an eddy covariance tower located in a corn field in Michigan, we have studied N2O emissions and its temporal variability. Our next steps include intercomparison of fluxes measured by eddy covariance with the traditional chamber method and investigation of factors controlling temporal variability. With these results, we could better constrain N2O emissions from agricultural activities. |
Ecosystem deposition of ammonia
Ammonia (NH3) is a precursor to ammonium aerosols and therefore has substantial implications on environmental quality. Agricultural activities such as fertilization and livestock waste management are known to dominate anthropogenic NH3 emissions, however significant uncertainties remain in understanding how much NH3 is contributed to surrounding ecosystems through dry deposition – or interaction of particles and gases with the land surface. Accurate measurements of NH3 are challenging, limiting our ability to understand this complex process. We have now developed and deployed two sensitive 9 μm QCL-based open-path sensors to quantify NH3 fluxes from the biosphere within forest canopies, natural grasslands, and from agricultural activities. Work is ongoing to conduct and analyze measurements at Duke Forest in North Carolina and Rocky Mountain National Park in Colorado. Future work includes integrating these data with satellite measurements to evaluate the variabilities of NH3 emissions between different spatiotemporal scales and studying the temporal variability of NH3 and emissions from fertilizer applications. |
 Open-path ammonia sensor set up at a grass field for eddy covariance analysis.
|
Sensor development
One of the leading uncertainties in understanding atmospheric chemistry and composition arises from critical observational gaps. Existing instrumentation or techniques are often too heavy, cumbersome, power hungry, or slow to address emissions or chemistry questions. This is especially true in regions without access to power (e.g. wetlands, fields, remote areas) or with complex and heterogeneous structure (cities). New advances in mid-infrared sensing - where molecules absorb the strongest and therefore have the highest sensitivity - allow unprecedented avenues for deployment on drones, fleets of vehicles, sensor networks, or in low power environments. We use optical-based techniques with quantum cascade lasers, interband cascade lasers, vertical cavity lasers, and new mid-infrared LEDs to develop sensors ranging from robust, one-of-a-kind measurements to low cost sensors. The sensors are first demonstrated in the laboratory, validated and calibrated, tested in local field environments, and finally deployed as part of field campaigns to address the science questions at hand. |
Satellite Ammonia Map
Monthly, high resolution (~2 km) ammonia (NH3) column maps from the 2008-2017 observations from the Infrared Atmospheric Sounding Interferometer (IASI) were developed across the contiguous United States. Ammonia hotspots, defined as those areas exceeding the 95th percentile of abundances, have a characteristic length scale of 12 km, showing the highly localized nature of ammonia emission sources. Furthermore, large seasonal variations were observed that differed by region, in part due to differences in the dominant types of agricultural activities. Areas with significant animal husbandry had peak column abundances in mid-summer, whereas cropland-dominated regions over the Midwest had spring maxima with shoulder peaks in autumn. A comparison between IASI oversampled NH3 column amounts, ground-monitored NH3 concentrations, and modeled NH3 column concentrations at selected hotspots demonstrates how these new analyses can be used to help constrain spatiotemporal variabilities of emission inventories as well as guiding the locations of future ground-based network sites. |
 2008-2017 IASI oversampled monthly map.
|